
The situation of XRP is going through a very crucial point because XRP is losing its price. Shareholders are concerned about the point of the slump. The second significant price point is that of $2.00, and the analysis of the market data indicates that this key support will be put to the test in the nearest future. We will look at the charts and important information that is indicative of this negative trend.
Key Price Target and Steep Slide
The price chart is a clear indication that XRP has been trending down since it reached a high of above $3.40 in the first half of the year. The recent price is approximately $2.395, which is a steep decline compared to the high prices in the recent past.
Due to this sharp drop, market analysts have been keenly following the level of $2.04. A further decrease in the price would cause a more intense sell-off.
This level was a good turning point in the past as can be seen in the price history. Thus, the zone of $2.00- $2.04 turns out to be the most significant goal in the next few weeks.
On-Chain Prudential Alerts of the MVRV Ratio
Further to this, there is a significant indicator that is giving an alarming signal, and it is the Market Value to Realized Value (MVRV) Ratio. This ratio is the comparison of the current price and the average price of coins that were last transferred.
The downward trend of the MVRV ratio in the past is given that a high percentage of the market is retaining tokens at a loss. The MVRV has declined since the recent peak in price indicating some cooling-off period.
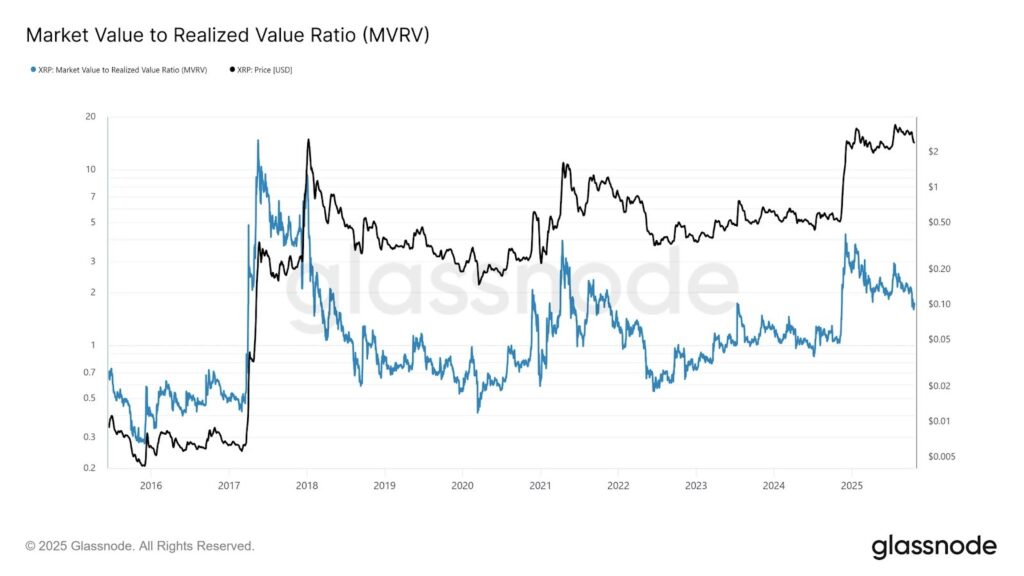
This change points to the fact that the market is not overvalued. In turn, it leaves no pressure in favor of a rapid recovery.
Liquidation Walls Action Affirms the Risk
Moreover, the Liquidation Heatmap favors the pessimistic perspective. The traders who take up borrowed money (leverage) will be forced to sell, this map indicates.
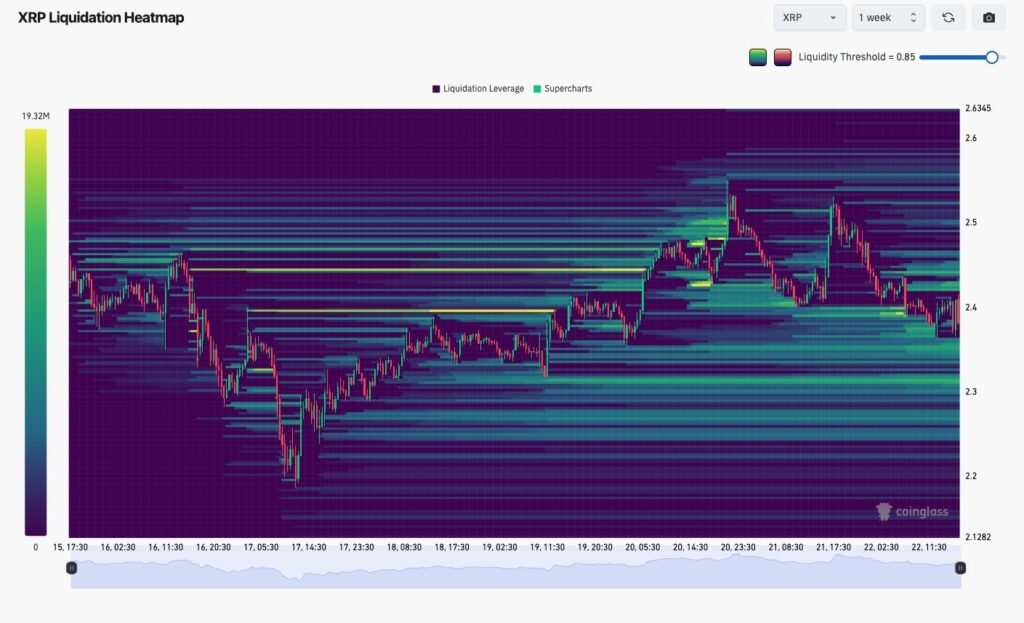
It now brings out big concentrations of the liquidation zones right below the prevailing price. Particularly, the liquidation leverage is high with clusters between $2.20 and $2.30.
Should the price sink along these lines, it will quickly roll down into a greater forced selling. This assemblage of leverage is a magnet that attracts the price downward and is a real risk, with the target of the price coming to $2.00. Thus, traders have no other choice but to go slow.