• CONTACT
  • BLOG

CryptoSwami.com

  • BOOKMARKS
  • Blog
    BlogShow More
    top dao investment
    Top 8 Investment DAOs
    October 2, 2024
    best AI tools
    25 Killer AI Tools
    September 8, 2024
    what is avalanche
    What is Avalanche (AVAX)?
    July 25, 2024
    Best Cryptocurrency to Buy Now
    Best Cryptocurrency to Buy Now
    May 9, 2024
    crypto presales
    Crypto Presales: How to Identify Legit One
    May 7, 2024
  • News
    NewsShow More
    Binance Lists Toncoin (TON) for Spot Trading, TON Soars 15%
    August 8, 2024
    Bearish Bitcoin Patterns Continue
    The US government’s $4 million bitcoin dump sparks market speculation: bullish or bearish?
    July 23, 2024
    Binance Introduces Fresh Look for WOTD Game, BNB Token Rallies
    Binance Introduces Fresh Look for WOTD Game, BNB Token Rallies
    May 23, 2024
    NOT Price Tumbles by 51.03%
    The Notcoin (NOT) price tumbled by 51.03% after Binance Halt trading.
    May 16, 2024
    PEPE Price Rallys 90% as Gamestop Saga Returns 
    PEPE Price Rallys 90% as Gamestop Saga Returns 
    May 15, 2024
  • Tips
    TipsShow More
    top dao investment
    Top 8 Investment DAOs
    October 2, 2024
    crypto presales
    Crypto Presales: How to Identify Legit One
    May 7, 2024
    crypto mining pools
    10 Best Crypto Mining Pools
    April 14, 2024
    Bitcoin Halving 2024: Countdown, Dates, and Impact
    February 14, 2024
    Cryptocurrency Glossary
    February 9, 2024
  • Buy&Sell
    Buy&SellShow More
    Best Cryptocurrency to Buy Now
    Best Cryptocurrency to Buy Now
    May 9, 2024
    9 best platforms to buy bitcoin in canada
    9 Best Platforms to Buy Bitcoin in Canada
    April 23, 2024
    How to Buy Bitcoin
    How to Buy Bitcoin: A Step-by-Step Guide
    April 20, 2024
    Where can I buy bitcoin in Nigeria?
    April 16, 2024
    buy Bitcoin with bank account transfer
    Buy Bitcoin With Bank Account Transfer On 14 Best Platforms
    April 7, 2024
  • Exchange
    ExchangeShow More
    9 best platforms to buy bitcoin in canada
    9 Best Platforms to Buy Bitcoin in Canada
    April 23, 2024
    buy Bitcoin with bank account transfer
    Buy Bitcoin With Bank Account Transfer On 14 Best Platforms
    April 7, 2024
    Cryptocurrency Trading Apps
    These 10 Crypto Apps Will Change Your Wallet Forever
    April 2, 2024
    how to buy dogecoin on etoro
    How To Buy Dogecoin On eToro In 5 Simple Steps
    February 3, 2024
    Buy Bitcoin With PayPal In 10 Minutes
    November 13, 2022
  • EarnCrypto
    EarnCryptoShow More
    crypto mining pools
    10 Best Crypto Mining Pools
    April 14, 2024
    what is crypto arbitrage trading
    What is Crypto Arbitrage Trading? How to Make Money with It
    March 30, 2024
    what is yield farming
    What is Yield Farming: How to Earn Passive Income?
    March 29, 2024
    earn cryptocurrency
    22 Effective Ways To Earn Cryptocurrency Online
    April 20, 2023
    best crypto staking
    Crypto Staking: 10 Best Platforms to Earn
    June 26, 2021
  • Coin
    CoinShow More
    Binance Lists Toncoin (TON) for Spot Trading, TON Soars 15%
    August 8, 2024
    How to Buy Bitcoin
    How to Buy Bitcoin: A Step-by-Step Guide
    April 20, 2024
    buy eth, buy ethereum
    The 10 Best Platforms to Buy Ethereum with Confidence.
    April 6, 2024
    BCH wallet
    BCH Wallet: 10 Best Bitcoin Cash Wallets App
    April 5, 2024
    buy matic polygon coin
    Buy Polygon Coin In 2025: A Comprehensive Guide
    February 20, 2024
  • Review
    ReviewShow More
    what is avalanche
    What is Avalanche (AVAX)?
    July 25, 2024
    Kraken Review – A Uncovered Review
    March 29, 2023
    bitbns review
    BitBNS Review: Unveiling the Pros and Cons
    September 1, 2022
    huobi globall review
    Huobi Global Review – Is Huobi Global Worth Using?
    January 1, 2022
    coinswitch review
    CoinSwitch Review: Is CoinSwitch Safe to Use?
    November 10, 2020
  • PaymentMethod
    PaymentMethodShow More
    buy Bitcoin with bank account transfer
    Buy Bitcoin With Bank Account Transfer On 14 Best Platforms
    April 7, 2024
    buy bitcoin with UPI transfer
    How To Buy Bitcoin With UPI Transfer?
    March 17, 2024
    buy bitcoin on cash app
    How To Buy Bitcoin On Cash App
    February 19, 2024
    buy bitcoin on venmo
    Buy Bitcoin on Venmo in 4 Simple and Secure Steps
    February 8, 2024
    Buy Bitcoin With PayPal In 10 Minutes
    November 13, 2022
  • Wallet
    WalletShow More
    BCH wallet
    BCH Wallet: 10 Best Bitcoin Cash Wallets App
    April 5, 2024
    Best Ethereum Wallets
    Top 10 Ethereum Mobile Wallets for Beginners and Crypto Pros
    April 3, 2024
    Anonymous Crypto Wallet
    15+ Secure Anonymous Crypto Wallets to Use in 2025
    April 2, 2024
    Cryptocurrency Trading Apps
    These 10 Crypto Apps Will Change Your Wallet Forever
    April 2, 2024
    buy bitcoin on cash app
    How To Buy Bitcoin On Cash App
    February 19, 2024
  • TradingChart
    TradingChartShow More
    cryptocurrency trading indicators
    Trading Indicators 101: Definition, Examples, Pros & Cons
    March 25, 2024
    How to Use Moving Averages for Crypto Buy and Sell Signals
    April 29, 2023
    Stochastic Oscillator Indicator: Benefits, Limitations, and Real Examples
    April 29, 2023
    Bollinger Bands Indicator: The Complete Guide for Crypto Traders
    April 28, 2023
  • Policy
  • Jobs
Reading: Trading Indicators 101: Definition, Examples, Pros & Cons
Share
CryptoSwami.comCryptoSwami.com
Font ResizerAa
Search
  • Blog
  • News
  • Tips
  • Buy&Sell
  • Exchange
  • EarnCrypto
  • Coin
  • Review
  • PaymentMethod
  • Wallet
  • TradingChart
  • Policy
  • Jobs
© CryptoSwami.com 2020-2024.

Home - TradingChart - Trading Indicators 101: Definition, Examples, Pros & Cons

TradingChartBlog

Trading Indicators 101: Definition, Examples, Pros & Cons

Trading indicators can help identify buy and sell signals, support resistance levels, and momentum shifts. However, indicators are not magic tools; they are best used alongside other analysis methods like market sentiment and risk management. Keeping in mind, this guide breaks down trading indicators, showing types, when to use them, and why some traders avoid them in volatile crypto markets.

Abhishek Rajbhar
Last updated: August 3, 2025 1:07 AM
Abhishek Rajbhar Published March 25, 2024
Share
cryptocurrency trading indicators

There are two primary ways to approach trading in the cryptocurrency market. First, learning technical analysis means understanding chart patterns, candlestick movements, and how the crypto market behaves. Second, by using a trading indicator, which helps traders analyze market trends, identify entry and exit points, and make data-driven decisions.

But what exactly is a trading indicator?

Many traders rely on popular trading indicators like the Relative Strength Index (RSI), moving averages, and MACD to fine-tune their strategies.

While no tool is foolproof, mastering how to read and apply a trading indicator can be a game-changer in maximizing profits and minimizing losses.

So, can you actually make a profit using a trading indicator?

The answer is yes, but success depends on how well you understand and apply it within your overall trading plan.

Continue reading to discover what trading indicators are, their types, some popular indicators and why to use them and why not.

Table of Contents

Toggle
  • What is a Trading Indicator?
    • Types of Trading Indicators
      • Economic indicators
      • Technical indicators
        • A) Momentum indicators
        • B) Volatility indicators
        • C) Volume indicators
        • D) Support and resistance indicators
    • The Best Common Trading Indicators for Crypto
      • Moving average (MA)
      • Moving Average Convergence Divergence (MACD)
      • Stochastic Oscillator
      • Relative Strength Index (RSI)
      • Bollinger Bands
      • Average True Range (ATR)
      • Fibonacci Retracement
      • On-Balance Volume (OBV)
      • Chaikin Money Flow (CMF)
      • Parabolic SAR
    • Why Use Trading Indicators?
    • Why Not Use Trading Indicators?
    • Conclusion.

What is a Trading Indicator?

Trading indicators are basically tools that provide the current and future condition of cryptocurrency for a given time period. All the forecasts are based on mathematical calculations such as price, volume, volatility, market sentiment, and other important data.

All predictions are based on historical data, which traders see in the form of a graph. Traders can adjust this graph according to their needs.

Trading indicators can help investors make informed decisions. Traders typically utilize indicators to confirm their technical analysis. Read in depth.

Types of Trading Indicators

There are two types of indicators: economic and technical indicators. However, in the world of cryptocurrency trading, we primarily focus on technical indicators. These indicators are based on price charts and trading volume data, helping traders make short-term decisions based on historical market behavior.

Economic indicators

This type of indicator depends on data published by the government and private institutions. This indicator is less helpful because the data is unreliable and estimated based on different scenarios.

Technical indicators

A technical indicator follows a mathematical calculation and uses price and volume as references. This indicator has wide use in cryptocurrency trading. This indicator is also categorized into different types. The most commonly used indicators are shown below.

A) Momentum indicators

This type of indicator indicates which direction the price of cryptocurrency is going in a given time period. The indicator shows a trend based on overbought and oversold sentiment and tells traders at what speed the price of a cryptocurrency is changing.

It can help in identifying trends, spotting reversals, confirming signals, and setting stop-loss levels. Using momentum indicators with other types of indicators can give a more accurate signal.

Examples: relative strength index, stochastic oscillator, moving average convergence divergence.

B) Volatility indicators

The volatility indicator shows how much risk is involved in the market by assessing the level of market uncertainty and potential price movements. Volatility indicators are useful for identifying periods of high or low market volatility.

It can help in market analysis, risk management, and making trading strategies.

Examples: average true range, Bollinger bands, volatility index.

C) Volume indicators

Volume indicators are helpful in analyzing the amount (number) of cryptocurrency traded during a given period of time. It provides insights into market participation, liquidity, and the strength of price movements.

By interpreting volume patterns, traders can gain valuable insights. It believes that if volume rises, the price will also rise, and if volume falls, the price will also fall.

It can help in confirming trends, identifying reversals, confirming breakouts, and assessing market sentiment.

Examples: on-balance volume, accumulation/distribution line, chaikin money flow.

D) Support and resistance indicators

This type of indicator is not supported by pro traders, but some traders still use it for stop loss management.

Support levels represent areas where buying pressure is strong enough to prevent prices from falling further, while resistance levels indicate areas where selling pressure prevents prices from rising higher.

These levels act as barriers to price movements and play a significant role in determining the reversal area.

It can help in identifying entry and exit points, setting stop-loss levels, and confirming breakdowns.

Examples: fibonacci, moving averages, horizontal support, and resistance.

Do you know what is arbitrage trading? Find out how it is different than trading.

The Best Common Trading Indicators for Crypto

The best common trading indicators include the Moving Average (MA), Relative Strength Index (RSI), MACD (Moving Average Convergence Divergence), Bollinger Bands, Stochastic Oscillator, Fibonacci Retracement, Ichimoku Cloud, Average True Range (ATR), Parabolic SAR, and Volume Indicator. Each trading indicator plays a unique role in helping traders analyze market trends and make informed decisions.

best indicator for trading?
Popular Trading Indicators

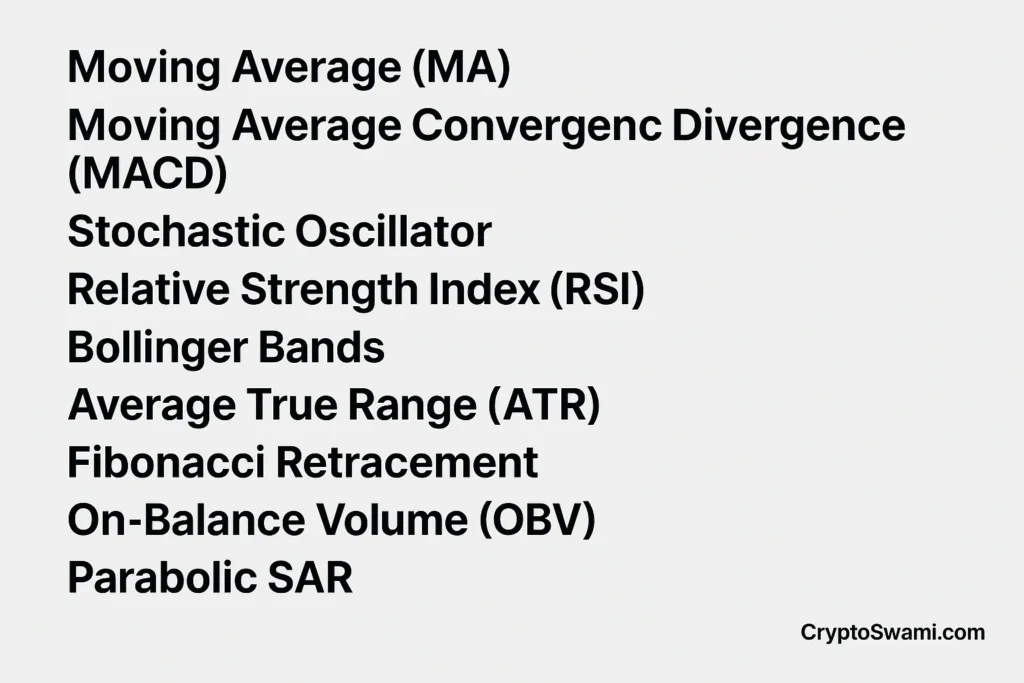
Below you can find overview of best trading indicators.

Moving average (MA)

It is a simple line present on the chart and moves up and down as the price moves. There are four types of MA, but the most popular is the simple moving average (SMA). The wider use strategies of MA are 200 days for the long period and 20 days for the short period. Read more.

Moving Average Convergence Divergence (MACD)

It shows a change in momentum and consists of three lines. One line is a MACD signal, and the other two lines—26 period and 12 period are moving averages. The 26-period MA is the slow-moving average, while the 12-period MA is the fast-moving average. Read More.

Stochastic Oscillator

Another indicator that shows a change in momentum and tells the overbought or oversold condition. It consists of two lines, %K and %D, in which the %K line is faster than the %D line. The signal range is between 0 and 100. If the %K line exceeds 80, it is considered overbought, and if it falls below 20, it is considered oversold. Read More

Relative Strength Index (RSI)

To calculate momentum, the RSI compares the recent gains and losses over a specified period. It works exactly as a stochastic oscillator, except the signal range. In RSI, 70 is considered overbought and 30 is considered oversold.

Bollinger Bands

Created by John Bollinger. It has three lines. The middle line is a simple moving average, and the upper and lower lines are standard deviation lines. They help traders identify volatility and potential reversal points. The upper and lower lines can be seen as resistance and support prices, while the middle line can be seen as the average price. Read More.

Average True Range (ATR)

It helps traders set stop-loss and take-profit levels based on volatility. ATR calculates the average range between high and low prices over a specified period to determine how volatile the market will be.

Fibonacci Retracement

This is one of the most popular indicators to find out the support and resistance prices. Traders use these prices to identify areas where the price may reverse or continue its trend.

On-Balance Volume (OBV)

This indicator calculates volume in a given time period. It gauges the strength of price movements and identifies potential trend reversals or continuations based on volume.

Chaikin Money Flow (CMF)

This indicator can identify the buying and selling pressure in the crypto market. It analyzes the incoming and outgoing money flow of a crypto coin based on price and volume.

Parabolic SAR

Parabolic SAR is a trend-following indicator that helps traders identify reversal points in the market. When the dots are below price bars, it suggests an uptrend, and when the dots are above price bars, it indicates a downtrend.

Why Use Trading Indicators?

  • A trading indicator helps new traders understand how different trading strategies work and how to apply them effectively.
  • It can identify small trendlines and price movements in the short term that are often missed by manual observation.
  • Trading indicators generate buy or sell signals based on specific technical conditions, helping traders determine precise entry and exit points.
  • They allow users to analyze historical data and backtest trading strategies before risking real money in live market conditions.
  • A trading indicator can assist in recognizing common chart and candlestick patterns like doji, triangles, head and shoulders, and flags.
  • Using indicators adds structure and discipline to trading, offering psychological support by reducing emotional decision-making.

Why Not Use Trading Indicators?

  • A trading indicator can complicate decision-making, especially when multiple indicators are used at once, leading to conflicting signals.
  • Relying solely on indicators may cause traders to overlook essential factors such as market sentiment, news events, and fundamental analysis.
  • In highly volatile markets, trading indicators often produce false signals, which can result in poor entry or exit decisions.
  • Repainting is a major drawback—this occurs when a trading indicator alters past signals after new data is added, making historical accuracy unreliable.
  • Many indicators are lagging by nature, meaning they react to price changes rather than predict them, reducing their effectiveness in fast-moving markets.
  • Since a trading indicator is based on mathematical formulas, it may not perform well across all cryptocurrency assets without manual tuning.
  • Popular indicators are used by a large number of traders, which can lead to crowded trades and reduced effectiveness due to market saturation.
  • Some trading indicators require extensive historical data, and in the case of new or low-volume cryptocurrencies, this may result in inaccurate or misleading signals.

Conclusion.

The most effective way to use a trading indicator is by combining it with broader technical analysis rather than depending on it alone. Indicators are tools, not guarantees and they work best when used as part of a well-researched strategy.

Traders should always backtest a trading indicator using historical data before applying it in live markets. Keep in mind that just because a specific indicator performs well with one cryptocurrency (like DOGE), it doesn’t mean it will give the same results with another (like ETH). Each crypto asset has its own behavior and volatility.

Most importantly, remember that a signal from any trading indicator does not guarantee a profit. Use it carefully, in combination with risk management and a clear strategy.

Note: This article is part of the “Understanding the Crypto Trading Chart” series. More articles keep coming.

You Might Also Like

Choose a Crypto Exchange With 13 Essential Points

AI Hentai Generator: Top 10 Picks

StormGain Review: Is it Safe?

Buy Bitcoin on Venmo in 4 Simple and Secure Steps

How To Buy Bitcoin On Cash App

TAGGED:cryptocurrencyearntrading

Sign Up For Daily Newsletter

Be keep up! Get the latest breaking news delivered straight to your inbox.
By signing up, you agree to our Terms of Use and acknowledge the data practices in our Privacy Policy. You may unsubscribe at any time.
Share This Article
Facebook Twitter Email Copy Link Print
By Abhishek Rajbhar
Yo, I'm Abhishek – your crypto confidant and the Web3 wizard! 🧙‍♂️ Join me on this wild ride through the cryptocurrency jungle. Spoiler alert: bitcoin $100k soon. 🚀
Previous Article cryptocurrency regulation in the UK Cryptocurrency regulation in the UK: Timeline & Impact
Next Article what is yield farming What is Yield Farming: How to Earn Passive Income?
Leave a comment

Leave a Reply Cancel reply

Your email address will not be published. Required fields are marked *

Follow US

Find US on Socials
FacebookLike
TwitterFollow
InstagramFollow
YoutubeSubscribe
TelegramFollow
LinkedInFollow
ThreadsFollow
Subscribe to our newslettern

Get Newest Articles Instantly!

Popular News
bitcoin forums
Bitcoin Forum: 30+ Crypto Forum To Start Debate
5 Best Crypto Derivative Trading Exchanges
dogecoin wallet
Buy Dogecoin: A Simple Guide

Follow Us on Socials

We use social media to react to breaking news, update supporters and share information

Twitter Facebook Instagram Youtube Linkedin Threads Telegram Tumblr
cryptoswami.com cryptoswami.com

Welcome to CryptoSwami.com. Your trusted guide for easy-to-understand information on cryptocurrencies. Navigate the world of digital assets effortlessly with our user-friendly resources.

Subscribe to our newsletter

You can be the first to find out the latest news and tips about trading, markets...

  • Disclaimer
  • Contact Us
  • Privacy Policy
  • Term and Condition
Reading: Trading Indicators 101: Definition, Examples, Pros & Cons
Share
© CryptoSwami.com 2020-2025.
Welcome Back!

Sign in to your account