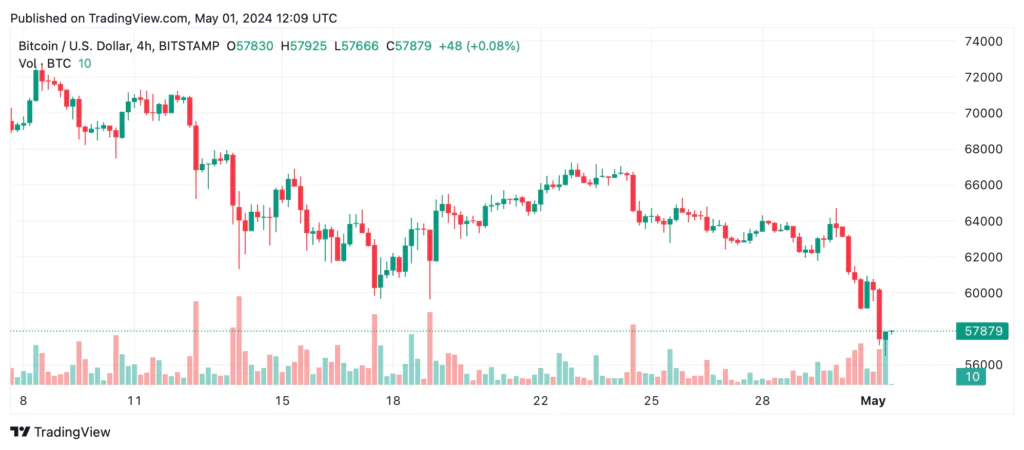
Bitcoin’s technical analysis suggests a long-term bearish trend, with substantial selling pressure and resistance to upward movement. At 8 a.m. ET, the price was trading between $57,505 and $58,059, and oscillators and moving averages indicated that the slide would continue.
Bitcoin Bearish Pattern Continues to Cause Uncertainty
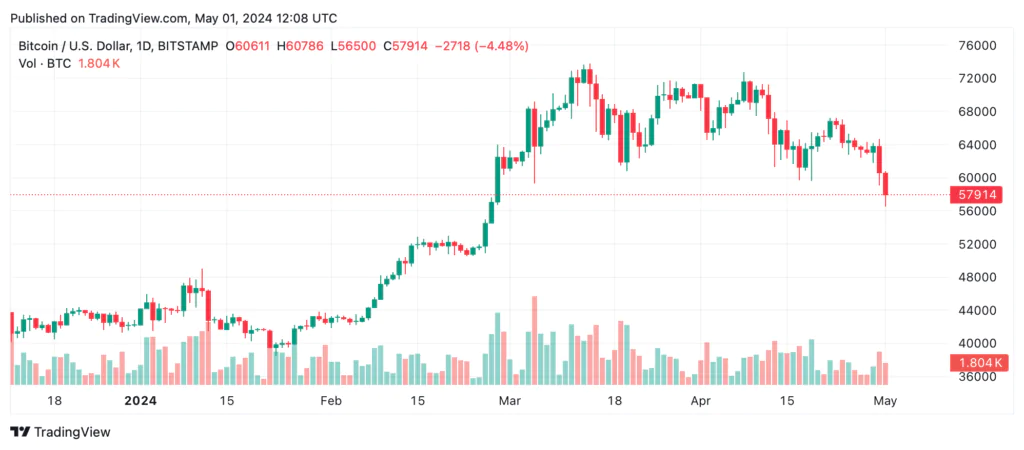
On the daily BTC/USD chart, the pattern of lower highs and lower lows indicates that the market is firmly in the hands of sellers, with the price peaking around $72,756 approximately 24 days ago before falling to recent lows of $56,500.
This substantial downward movement is characterized by high selling volumes and the absence of notable bullish reversals, indicating a favorable environment for cautious trading tactics.
The oscillator data supports the current bearish attitude. The relative strength index (RSI), the stochastic, the commodity channel index (CCI), and the moving average convergence divergence (MACD) all show values that are neutral to negative, which means that you should sell. The momentum indicator’s steep drop to -7467 and the MACD’s bearish position of -1510 are especially noticeable, indicating an intense negative mood in the market that may not turn around in the immediate term.